Student Affairs
Creating Pathways to Student Success
Student Affairs supports students from their first interaction with Southwestern College through graduation, transfer, and career success. Our departments work together to provide guidance, resources, opportunities, and support that help every student thrive.
Message from Assistant Superintendent/Vice President of Student Affairs, Dr. Rachel Fischer

Welcome to Student Affairs! At Southwestern College, Student Affairs is here to support you throughout your entire educational journey. Whether you are exploring college for the first time, returning to continue your education, preparing to transfer, or seeking career opportunities our team is committed to helping you achieve your goals.
We believe that every student deserves to feel welcomed, valued, and connected. Through a wide range of services, programs, resources, and engagement opportunities, we strive to create an inclusive environment where all students can thrive academically, personally, and professionally.
Our dedicated team is here to help you navigate college, overcome challenges, discover opportunities, and build a sense of belonging within our Jaguar community. We invite you to explore the many services available through Student Affairs and encourage you to reach out whenever you need support. Equitable student access and success is our purpose, and we look forward to helping you every step of the way.
Goal #1: Continue to actively and intentionally work to become an anti-racist and inclusive organization that creates a sense of community, belonging and space for all employees and disproportionately impacted students (including, but not limited to Black, Male, Hispanic, Pacific Islander/Native Hawaiian, Disabled, Dreamers, LGBTQIA+ and Restorative Justice) to thrive.
Goal #2: Use disaggregated data to create structures that enhance equitable and inclusive practices that result in increased support and students completing their educational goals.
Goal #3: Enhance the Student Experience by institutionalizing Jaguar Pathways. Improve our overall Organizational Effectiveness through efficient communication, collaboration, delivery of services, and use of institutional resources.
Goal #4: Develop a well-structured onboarding process for Student Affairs professionals to foster an environment of professional learning and community.
Making a Difference for Students
Student Affairs is home to many programs and services dedicated to student success. The infographics below feature a few examples of how departments, including Financial Aid, CARE, and CalWORKs, are supporting students, addressing challenges, and creating meaningful outcomes. Accessible text versions of each infographic are available below.
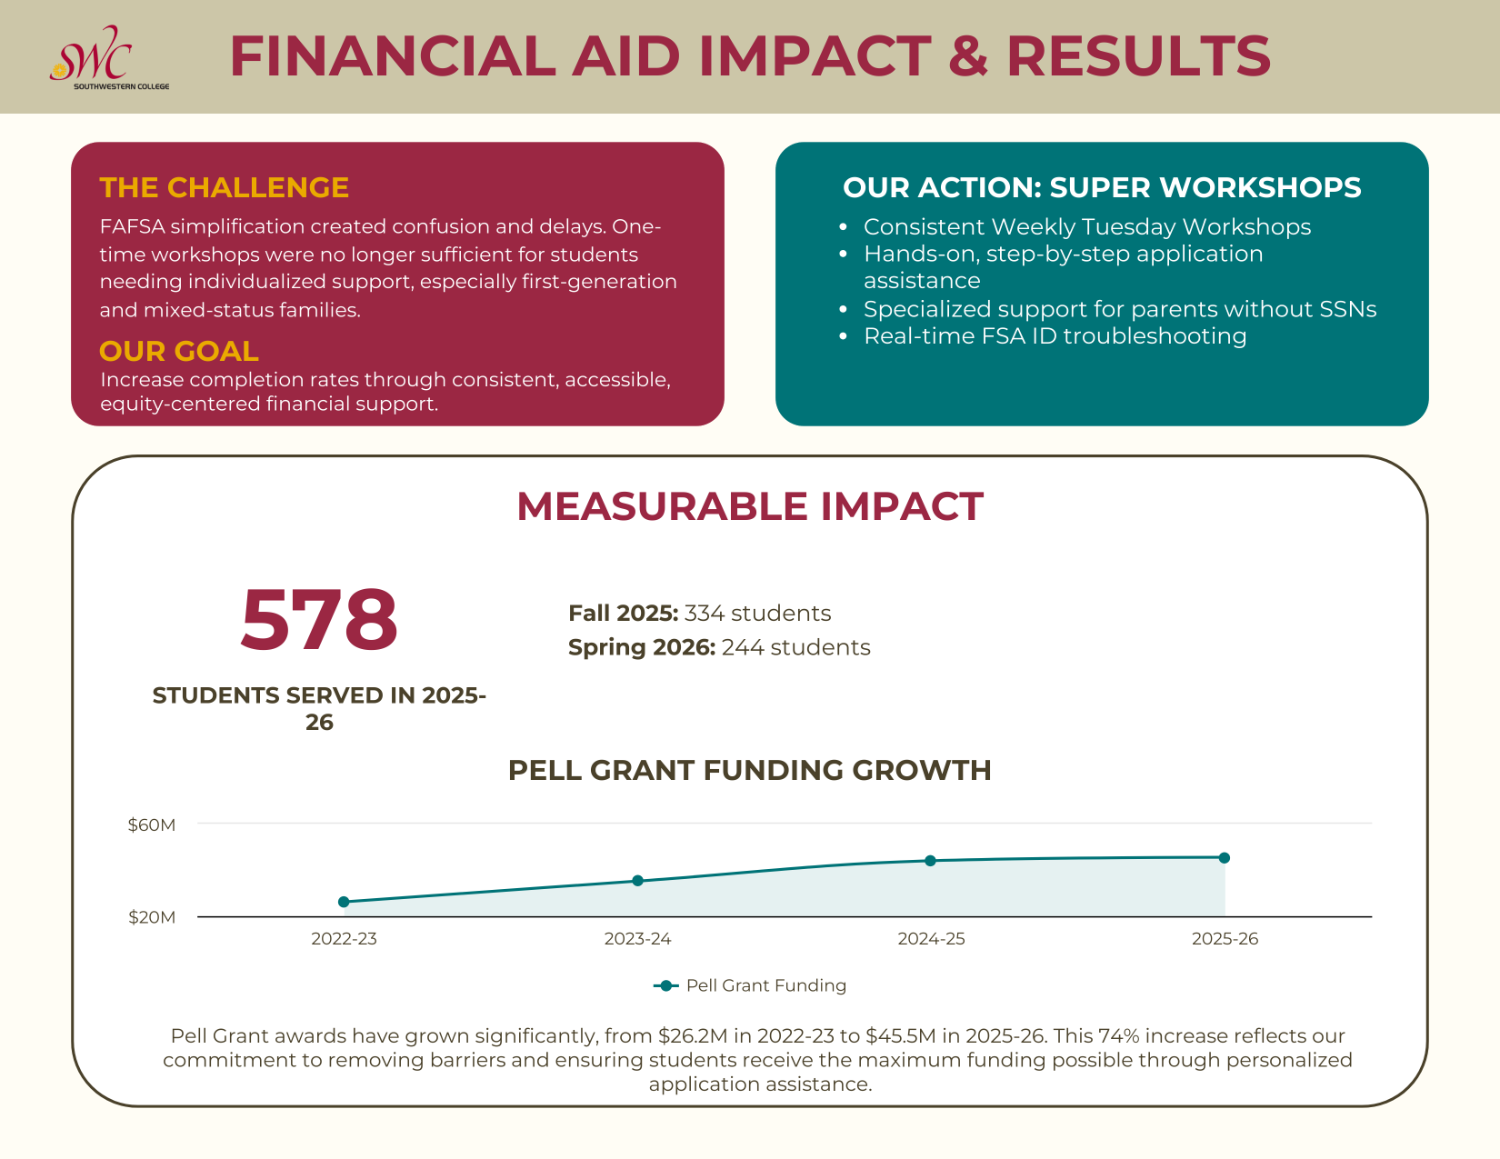
The infographic highlights how Southwestern College's Financial Aid Office responded to challenges associated with FAFSA simplification and demonstrates the measurable impact of expanded student support services.
In the upper left section titled "The Challenge," the infographic explains that FAFSA simplification created confusion and delays for students. It notes that one-time workshops were no longer sufficient for students needing individualized support, particularly first-generation students and mixed-status families.
Directly below, under "Our Goal," the infographic states that the Financial Aid Office aimed to increase completion rates through consistent, accessible, and equity-centered financial support.
In the upper right section titled "Our Action: Super Workshops," the infographic outlines strategies implemented to support students. These efforts included consistent weekly Tuesday workshops, hands-on step-by-step FAFSA application assistance, specialized support for parents without Social Security Numbers, and real-time FSA ID troubleshooting.
The center section, titled "Measurable Impact," presents student participation data. The infographic reports that 578 students were served during the 2025-26 academic year, including 334 students in Fall 2025 and 244 students in Spring 2026.
Below the participation data, a chart titled "Pell Grant Funding Growth" illustrates the increase in Pell Grant awards over time. The chart shows Pell Grant funding growing from $26.2 million in 2022-23 to $45.5 million in 2025-26.
The infographic concludes with a summary statement noting that Pell Grant awards increased by 74 percent between 2022-23 and 2025-26. According to the infographic, this growth reflects the Financial Aid Office's commitment to removing barriers and ensuring students receive the maximum funding available through personalized application assistance.
Key Finding: The expanded workshop model and individualized support services helped increase student engagement with financial aid resources, contributing to substantial growth in Pell Grant funding and improving access to financial assistance for students.
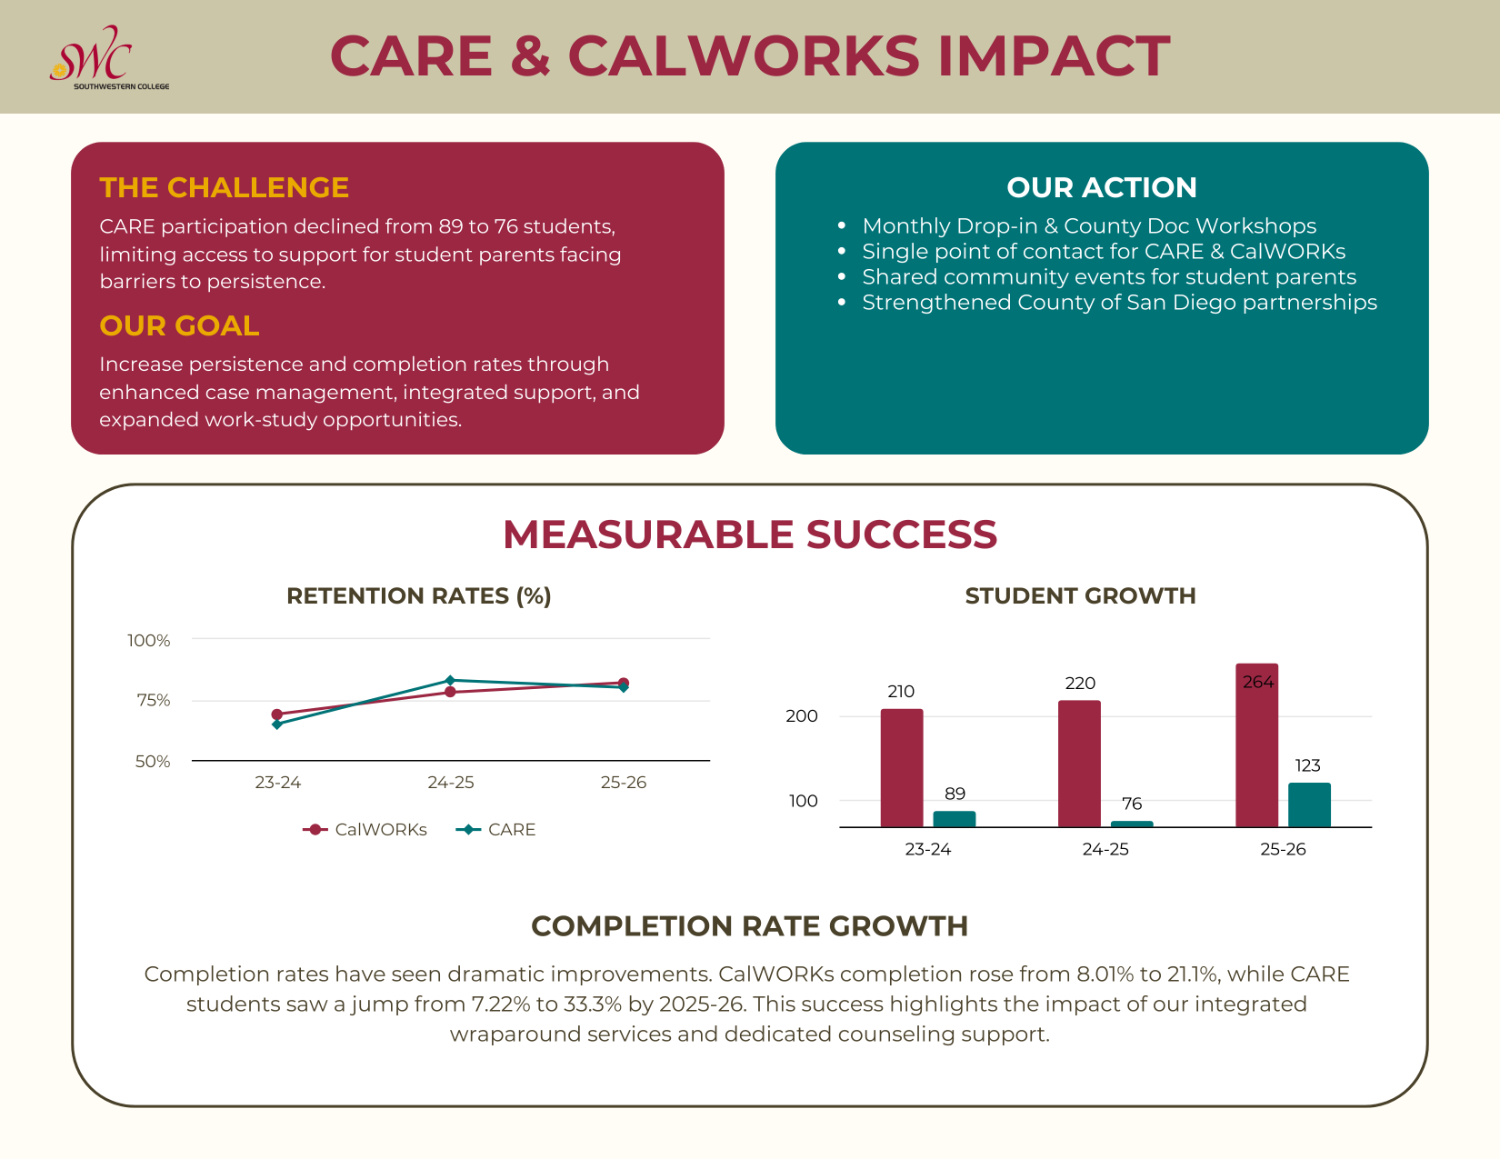
The infographic highlights how Southwestern College's CARE and CalWORKs programs addressed declining participation among student parents and demonstrates the measurable outcomes of enhanced support services.
In the upper left section titled "The Challenge," the infographic explains that CARE participation declined from 89 students to 76 students, limiting access to support services for student parents facing barriers to persistence.
Directly below, under "Our Goal," the infographic states that the programs sought to increase persistence and completion rates through enhanced case management, integrated support services, and expanded work-study opportunities.
In the upper right section titled "Our Action," the infographic outlines strategies implemented to support student parents. These efforts included monthly drop-in and County Doc workshops, a single point of contact for CARE and CalWORKs participants, shared community events for student parents, and strengthened partnerships with the County of San Diego.
The center section, titled "Measurable Success," presents data on retention rates and student participation growth across multiple academic years.
On the left, a chart titled "Retention Rates (%)" shows that both CARE and CalWORKs students maintained strong retention rates over time. Retention rates increased between the 2023-24 and 2025-26 academic years, demonstrating continued student persistence and engagement.
On the right, a chart titled "Student Growth" illustrates changes in student participation. CalWORKs student participation increased from 210 students in 2023-24 to 220 students in 2024-25 and 264 students in 2025-26. CARE participation measured 89 students in 2023-24, declined to 76 students in 2024-25, and then increased substantially to 123 students in 2025-26.
At the bottom of the infographic, a section titled "Completion Rate Growth" highlights significant improvements in student completion outcomes. The infographic states that CalWORKs completion rates increased from 8.01% to 21.1%, while CARE completion rates increased from 7.22% to 33.3% by 2025-26.
The infographic concludes that these improvements reflect the impact of integrated wraparound services and dedicated counseling support designed to help student parents persist and reach their educational goals.
Key Finding: Enhanced case management, coordinated support services, and strengthened community partnerships contributed to increased student participation, strong retention rates, and substantial growth in completion rates among CARE and CalWORKs students.
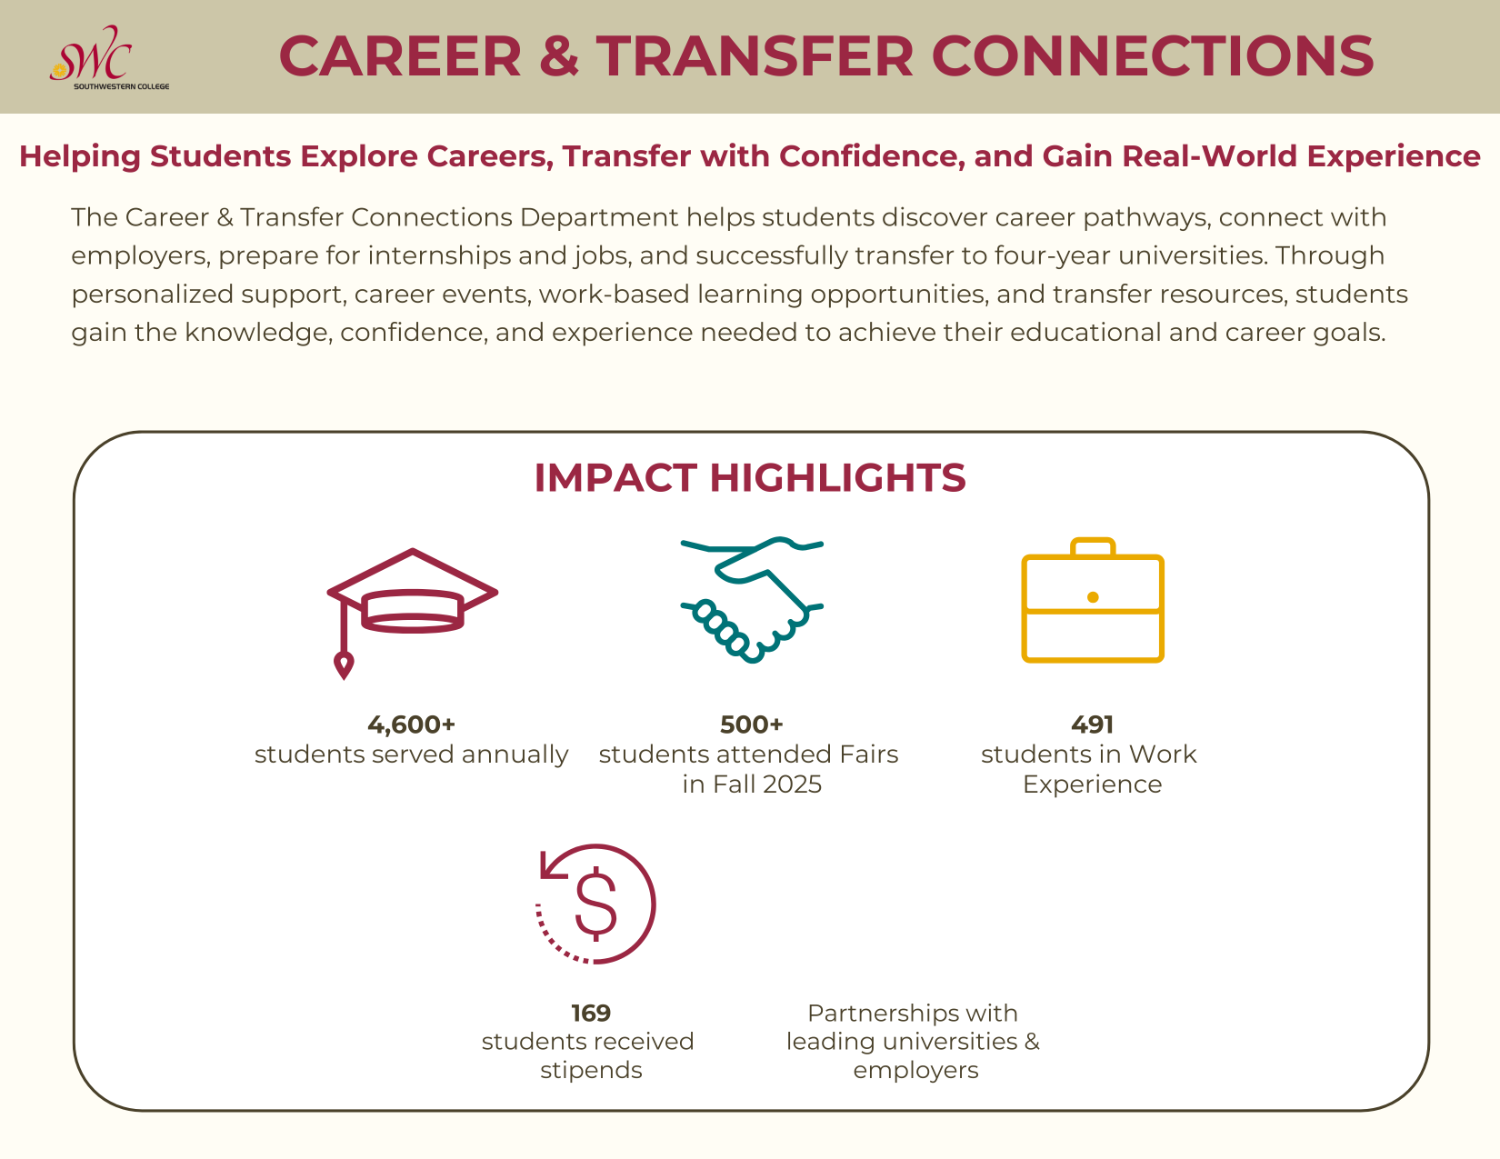
The first infographic introduces Southwestern College's Career & Transfer Connections Department and highlights the department's role in helping students explore careers, prepare for transfer, and gain real-world experience.
At the top of the infographic it states, The Career & Transfer Connections Department helps students discover career pathways, connect with employers, prepare for internships and jobs, and successfully transfer to four-year universities. Through personalized support, career events, work-based learning opportunities, and transfer resources, students gain the knowledge, confidence, and experience needed to achieve their educational and career goals.
Below this introduction, a section titled "Impact Highlights" presents key service outcomes. The infographic states that more than 4,600 students are served annually. It also notes that more than 500 students attended career and transfer fairs during Fall 2025.
Additional impact measures indicate that 491 students participated in work experience opportunities and 169 students received stipends. The infographic concludes by highlighting partnerships with leading universities and employers that help support student success.
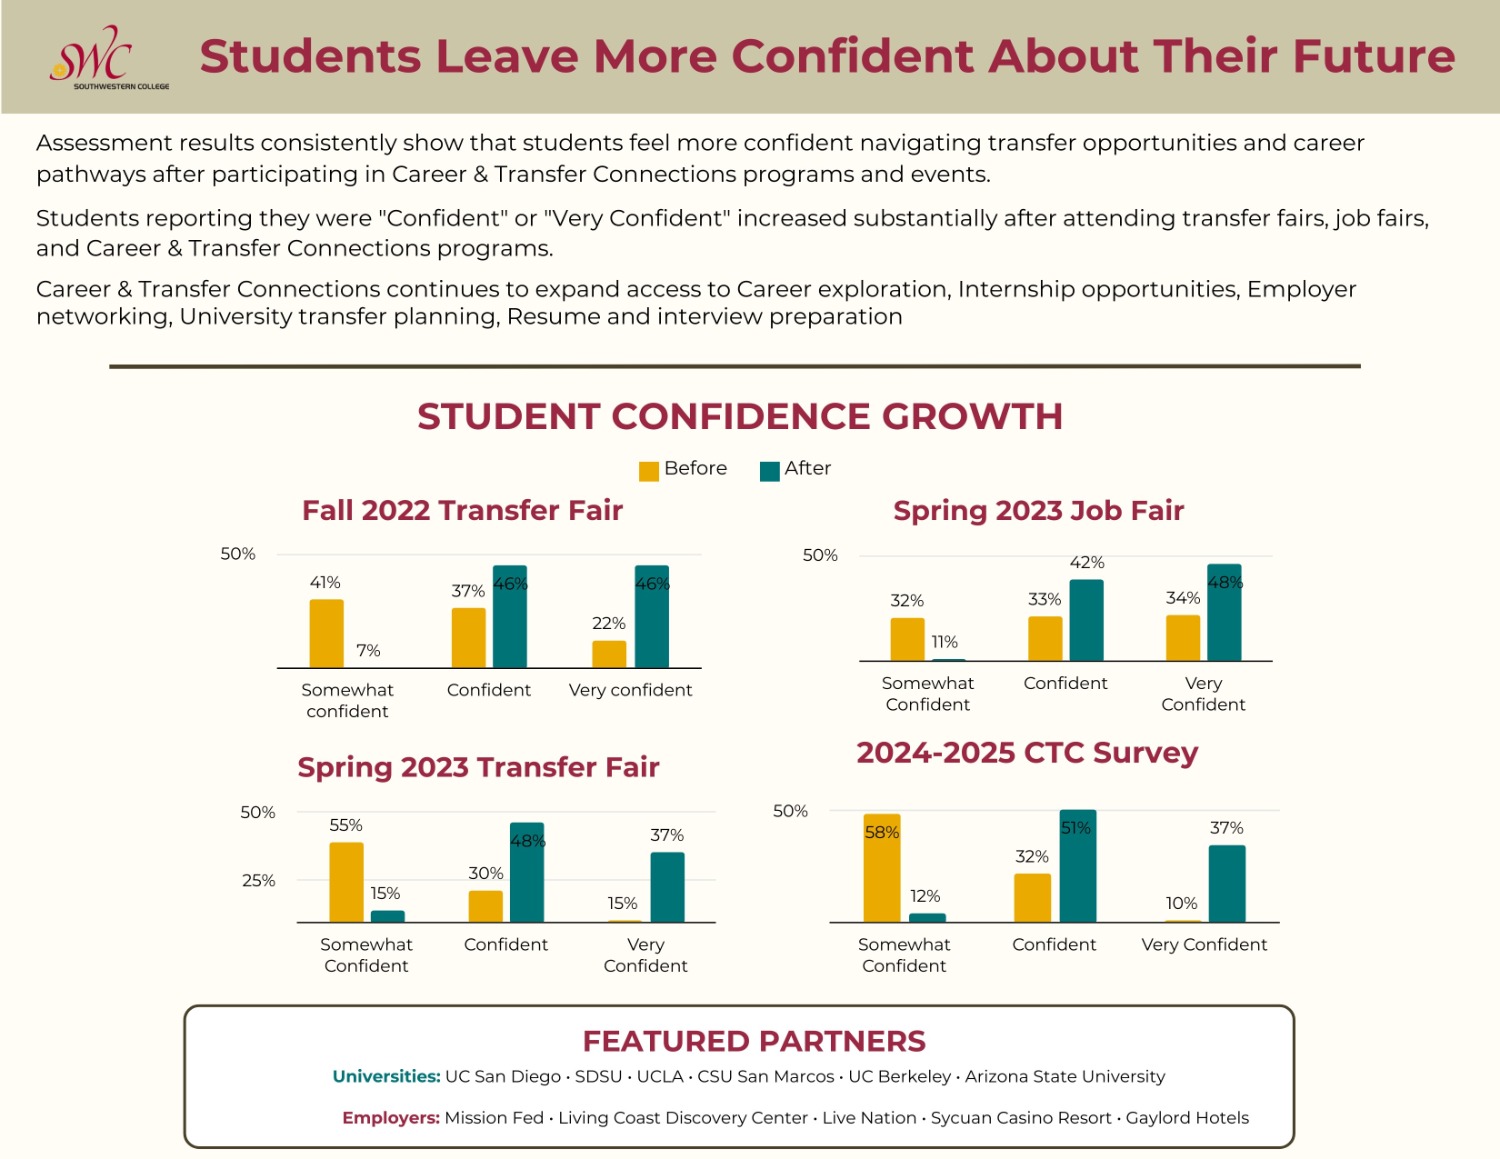
The second infographic, Students Leave More Confident About Their Future, presents assessment data demonstrating increased student confidence after participating in Career & Transfer Connections programs and events.
At the top of the infographic it states, assessment results consistently show that students feel more confident navigating transfer opportunities and career pathways after participating in Career & Transfer Connections programs and events.
Students reporting they were "Confident" or "Very Confident" increased substantially after attending transfer fairs, job fairs, and Career & Transfer Connections programs.
Career & Transfer Connections continues to expand access to career exploration, internship opportunities, employer networking, university transfer planning, résumé preparation, and interview preparation.
The center section, titled "Student Confidence Growth," includes four bar charts comparing student confidence levels before and after participation in Career & Transfer Connections activities.
For the Fall 2022 Transfer Fair, students reporting they were somewhat confident decreased from 41% before participation to 7% after participation. Students reporting they were confident increased from 37% to 46%, while students reporting they were very confident increased from 22% to 46%.
For the Spring 2023 Job Fair, students reporting they were somewhat confident decreased from 32% to 11%. Students reporting they were confident increased from 33% to 42%, and students reporting they were very confident increased from 34% to 48%.
For the Spring 2023 Transfer Fair, students reporting they were somewhat confident decreased from 55% to 15%. Students reporting they were confident increased from 30% to 48%, while students reporting they were very confident increased from 15% to 37%.
For the 2024–2025 Career & Transfer Connections Survey, students reporting they were somewhat confident decreased from 58% to 12%. Students reporting they were confident increased from 32% to 51%, and students reporting they were very confident increased from 10% to 37%.
At the bottom of the infographic, a section titled "Featured Partners" lists university and employer partners. Universities include UC San Diego, San Diego State University, UCLA, CSU San Marcos, UC Berkeley, and Arizona State University. Employer partners include Mission Fed, Living Coast Discovery Center, Live Nation, Sycuan Casino Resort, and Gaylord Hotels.
Overall, the infographic demonstrates that participation in Career & Transfer Connections programs is associated with increased student confidence in career exploration, transfer planning, and future educational and career pathways.
Provide your feedback on BizChat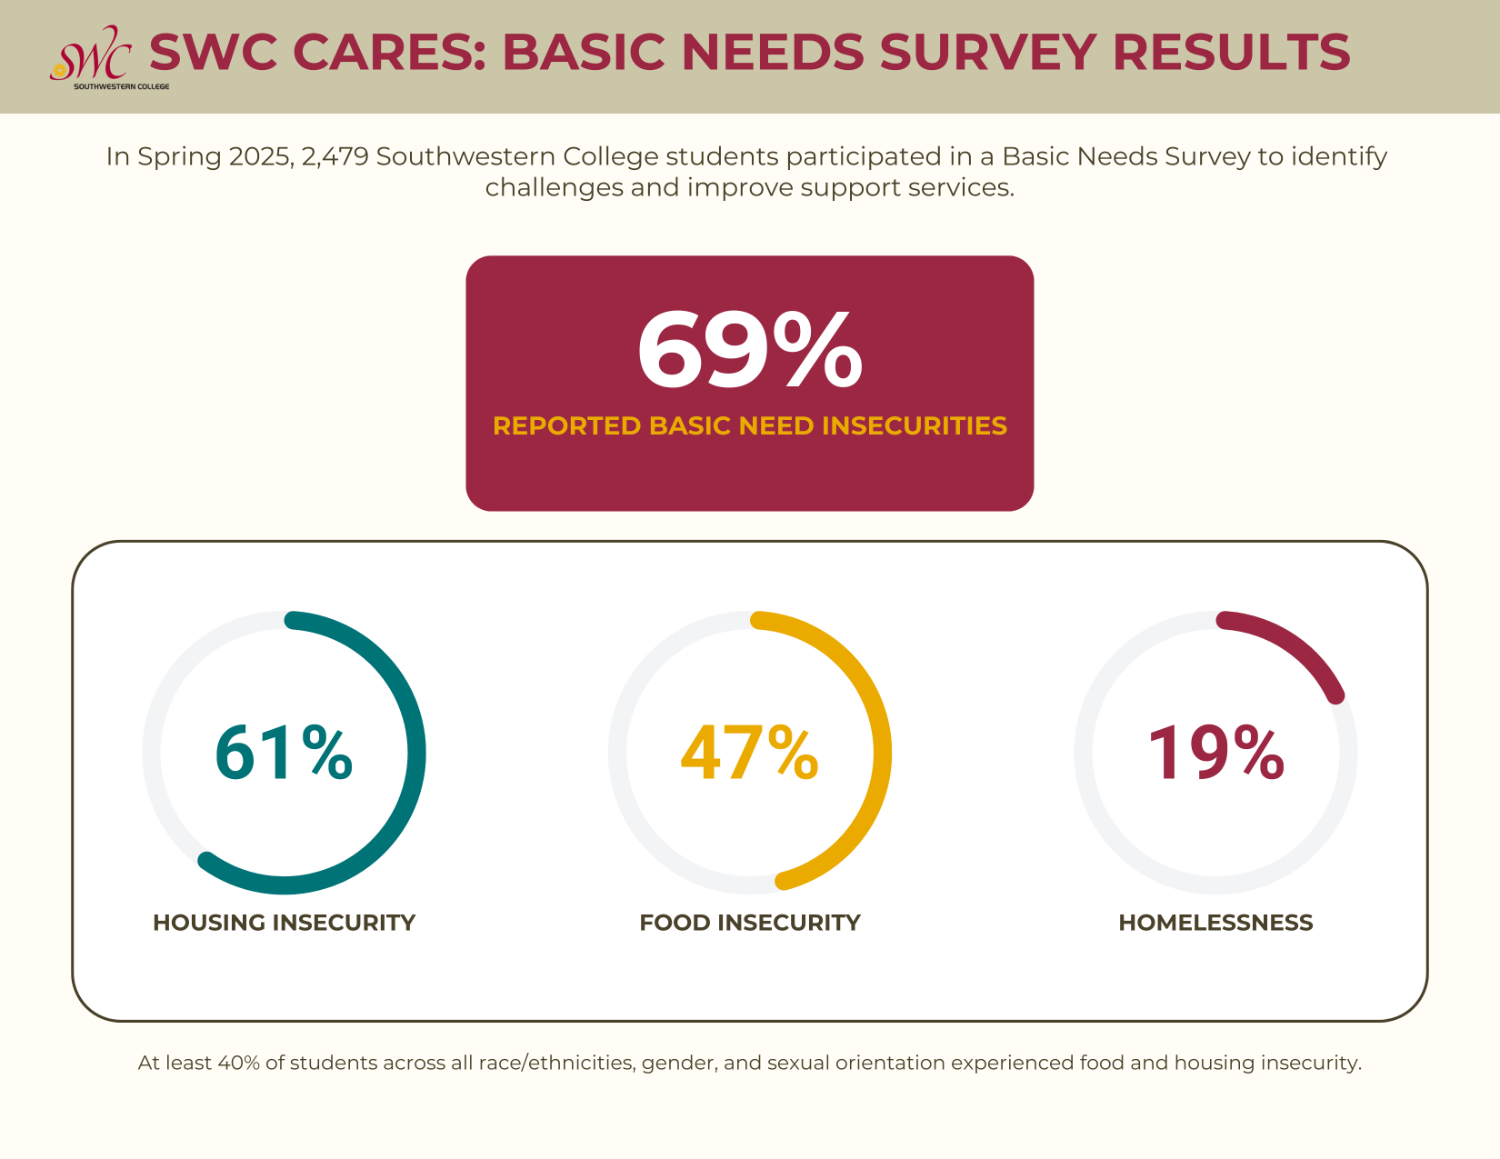
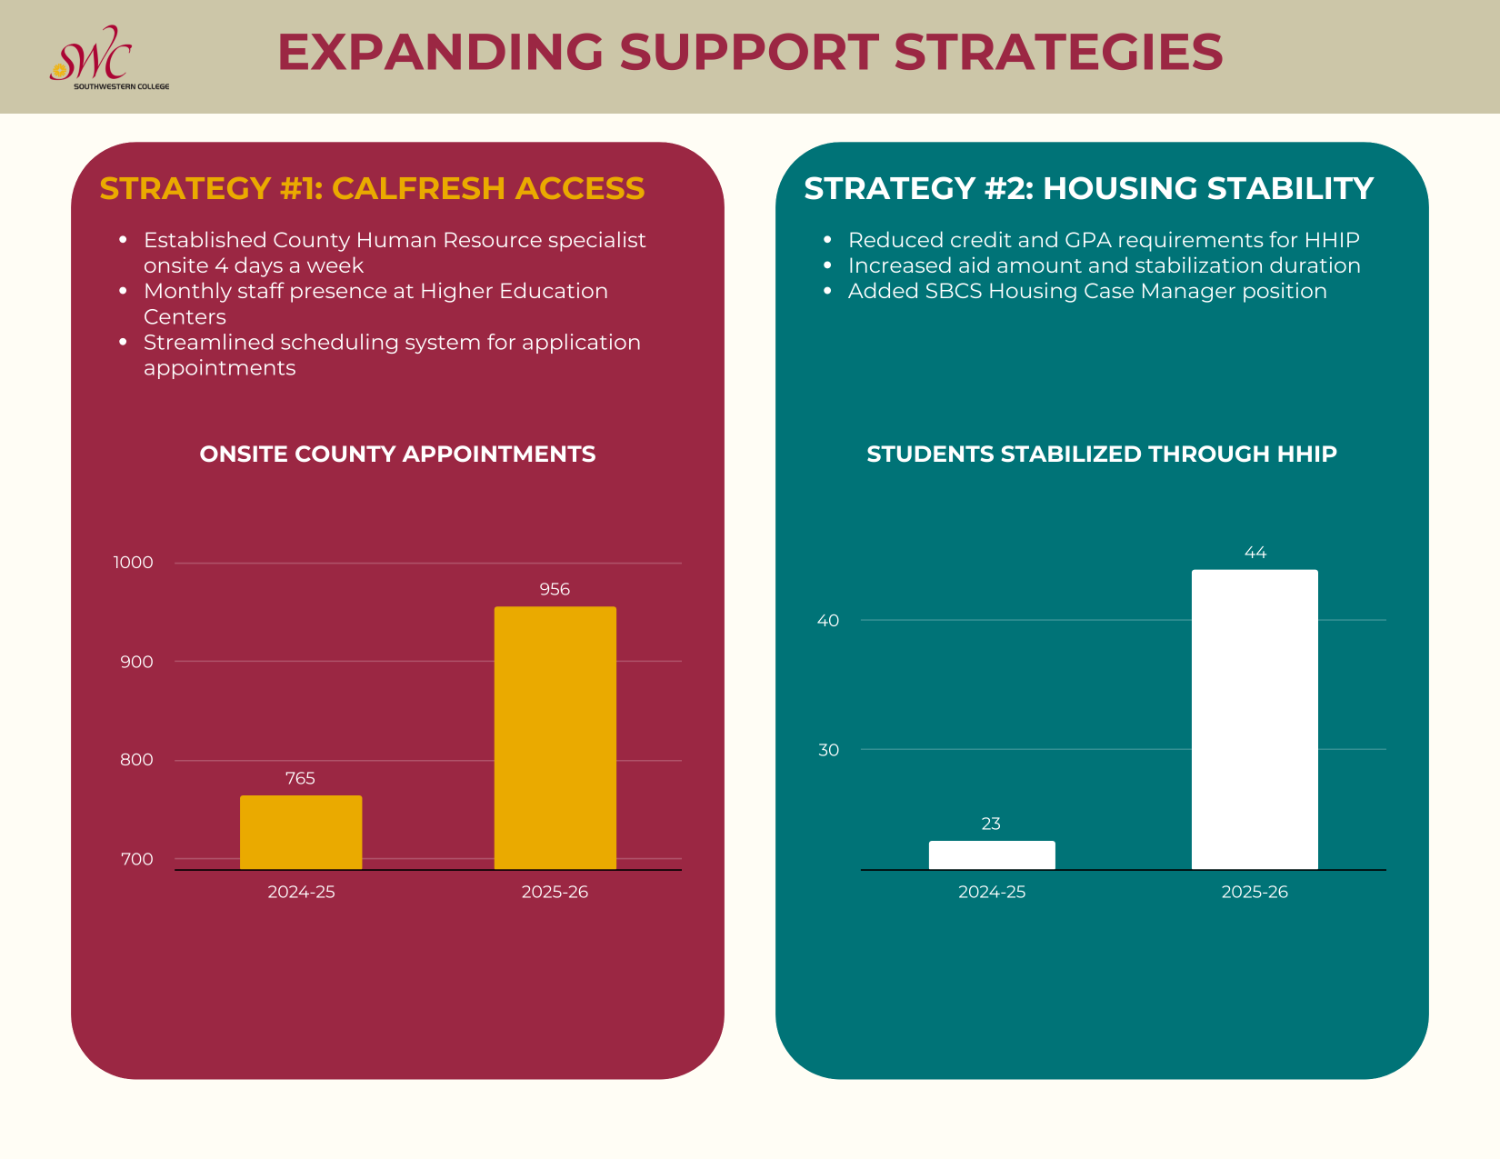
The first infographic highlights two strategies implemented by Southwestern College to address basic needs challenges and improve student access to public benefits and housing support.
On the left side of the infographic, a section titled "Strategy #1: CalFresh Access" describes efforts to increase student access to CalFresh benefits. The strategy included establishing a County Human Resource specialist onsite four days per week, maintaining a monthly staff presence at Higher Education Centers, and streamlining the scheduling system for CalFresh application appointments.
Below this section, a chart titled "Onsite County Appointments" shows substantial growth in student appointments. The number of appointments increased from 765 in 2024-25 to 956 in 2025-26, demonstrating expanded access to CalFresh application assistance.
On the right side of the infographic, a section titled "Strategy #2: Housing Stability" outlines enhancements to the Housing and Homelessness Incentive Program (HHIP). These actions included reducing credit and GPA requirements for participation, increasing both aid amounts and stabilization duration, and adding an SWC Cares Housing Case Manager position.
Below this section, a chart titled "Students Stabilized Through HHIP" shows the number of students supported through housing stabilization services. The chart indicates that 23 students were stabilized in 2024-25, increasing to 44 students in 2025-26.
Key Finding: Expanded access to CalFresh services and enhanced housing support programs resulted in increased student participation and a greater number of students receiving assistance to address food and housing insecurity.
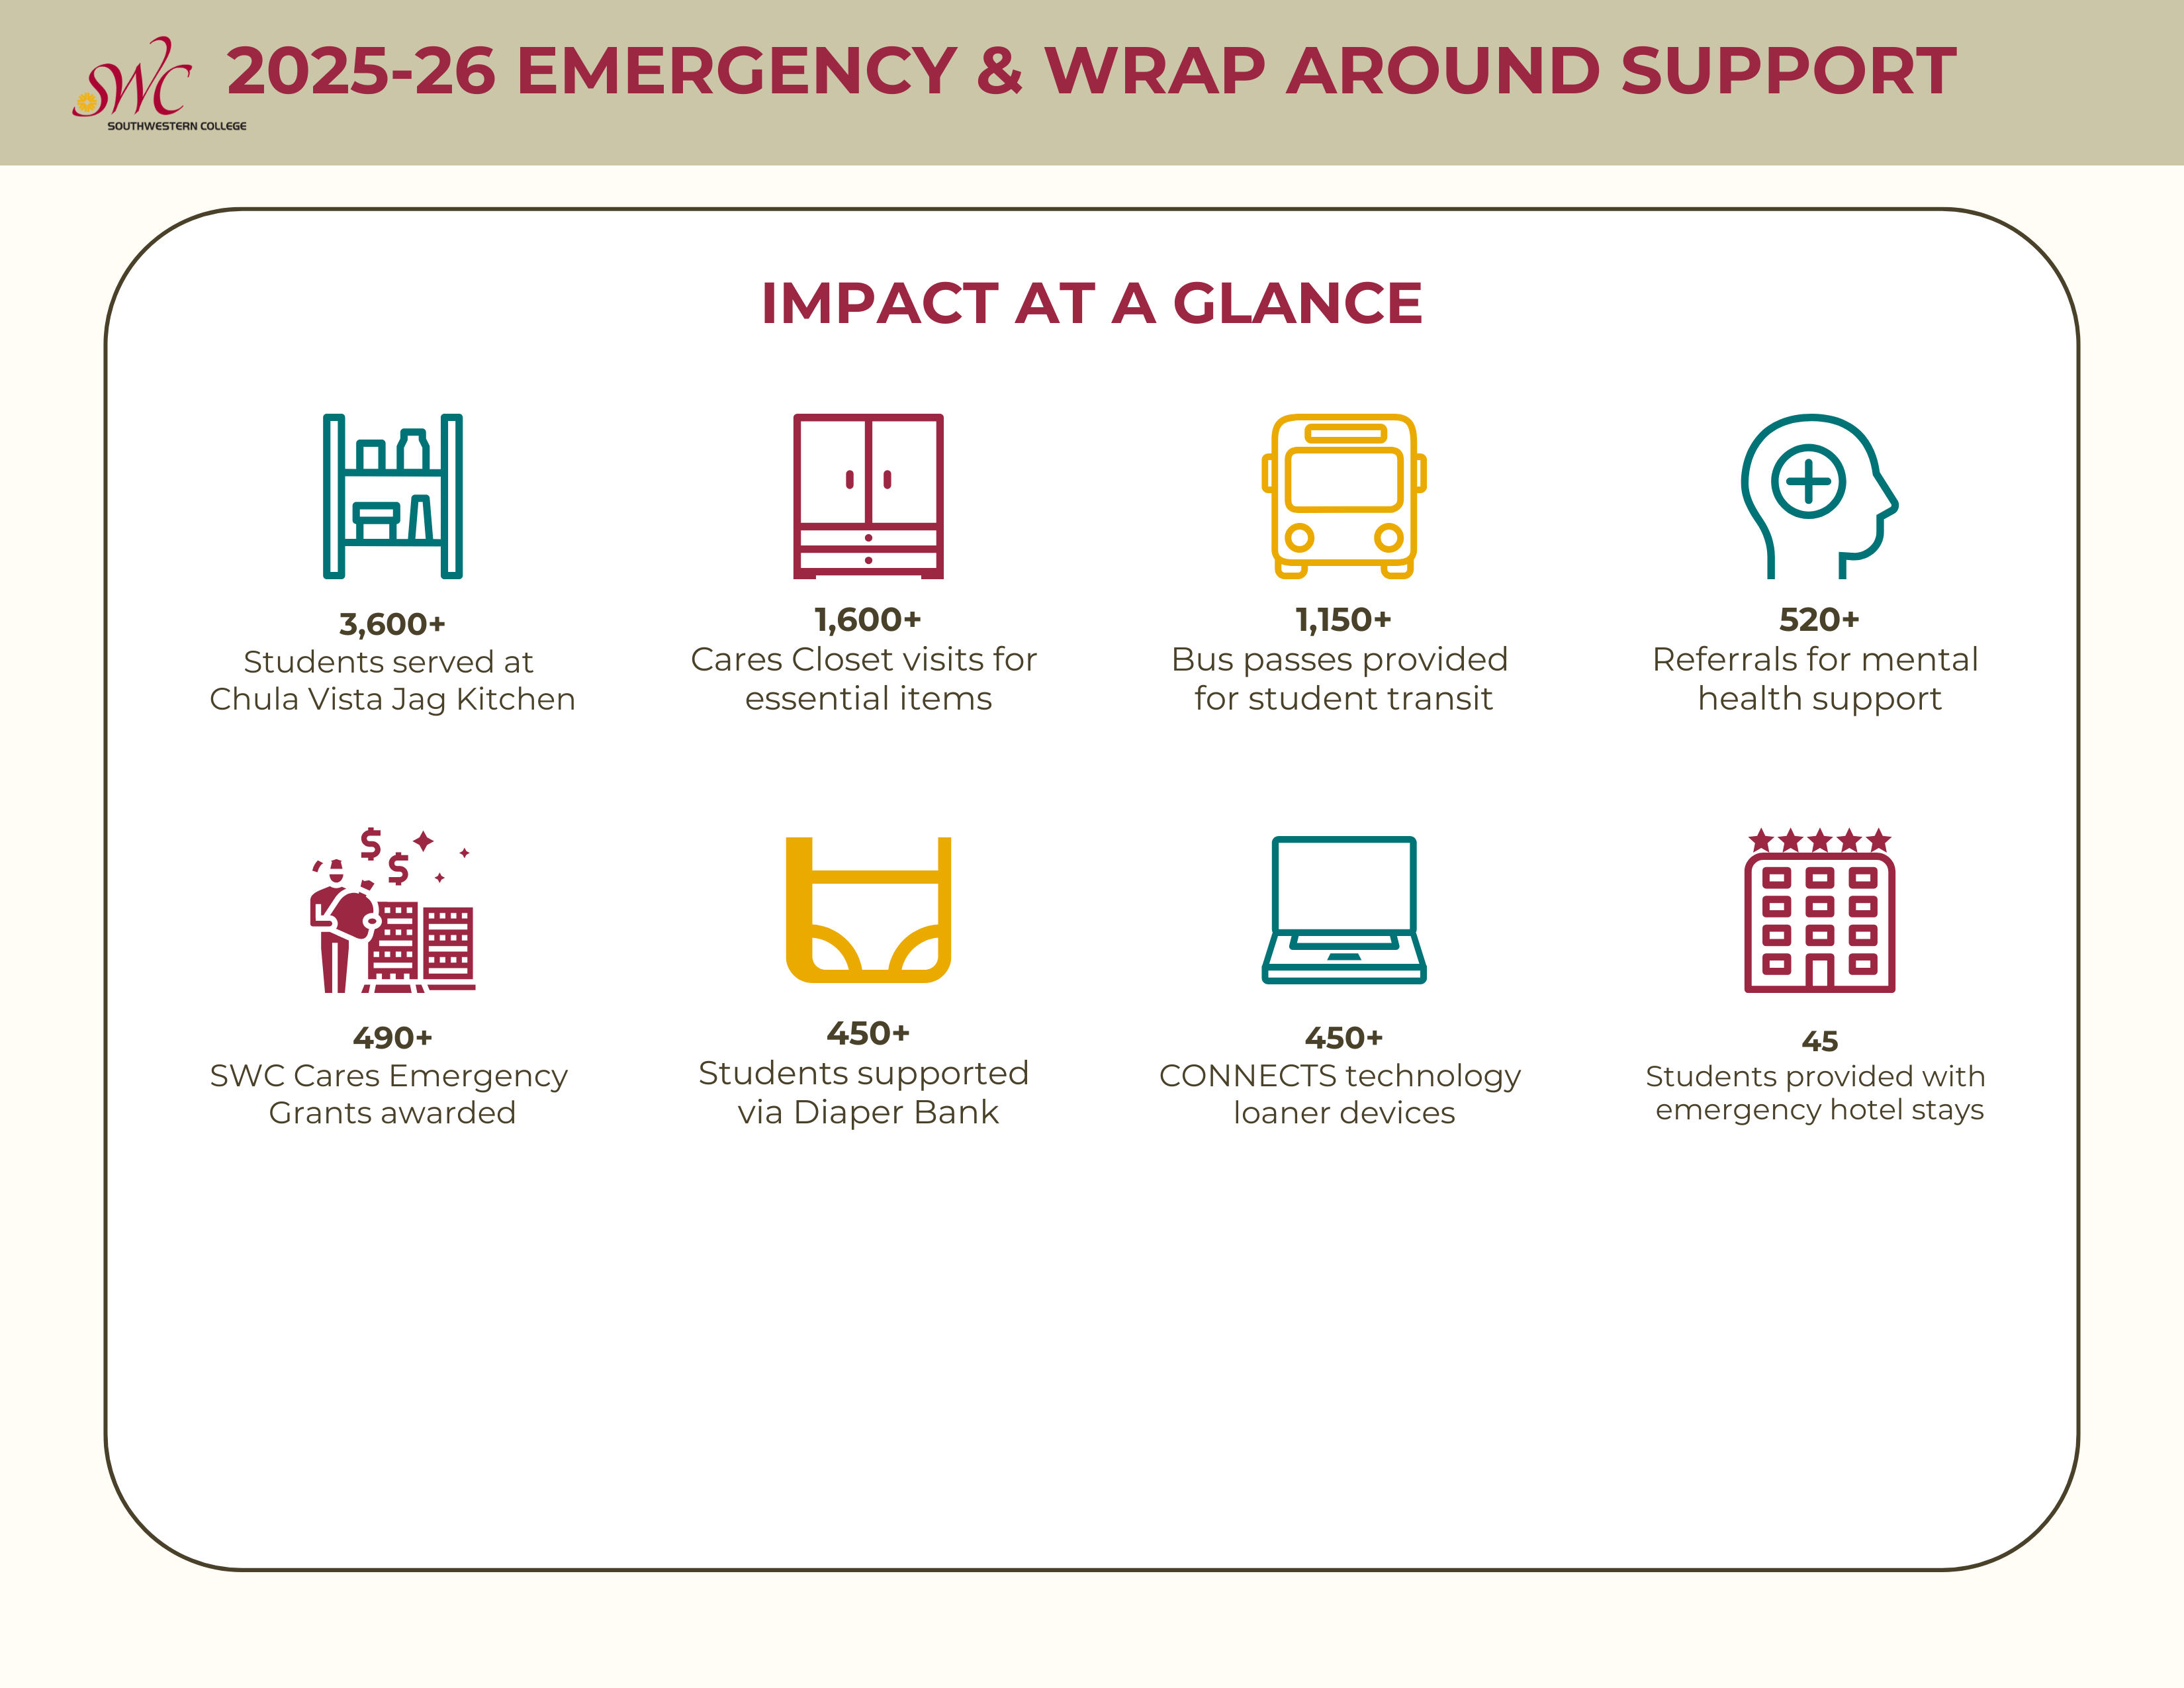
The second infographic provides an overview of emergency assistance and basic needs services provided to Southwestern College students during the 2025-26 academic year.
At the center of the infographic, a section titled "Impact at a Glance" presents key service outcomes across multiple support programs.
The infographic reports that more than 3,600 students received services through the Chula Vista Jag Kitchen. It also notes that more than 1,600 visits were made to the SWC Cares Closet for essential items.
Additional transportation support included more than 1,150 bus passes provided to students to support student transit needs. The infographic also indicates that more than 520 referrals were made for mental health support services.
Financial assistance programs awarded more than 490 SWC Cares Emergency Grants to students experiencing urgent financial needs. Family support services assisted more than 450 students through the Diaper Bank program.
Technology access remained a key support area, with more than 450 CONNECTS technology loaner devices provided to students. The infographic also reports that 45 students received emergency hotel stays to address urgent housing needs.
Key Finding: Southwestern College's emergency and wraparound support services provided food assistance, transportation, mental health referrals, emergency funding, technology access, family support resources, and housing assistance to thousands of students during the 2025-26 academic year.
The third infographic presents findings from Southwestern College's Spring 2025 Basic Needs Survey and highlights the prevalence of basic needs insecurity among students.
At the top of the infographic, a statement notes that 2,479 Southwestern College students participated in a Basic Needs Survey during Spring 2025. The purpose of the survey was to identify challenges experienced by students and inform improvements to support services.
In the center of the infographic, a highlighted statistic reports that 69% of survey respondents experienced at least one form of basic needs insecurity.
Below this finding, the infographic presents three key measures of student need.
The first graphic shows that 61% of respondents reported housing insecurity.
The second graphic shows that 47% of respondents reported food insecurity.
The third graphic shows that 19% of respondents reported experiencing homelessness.
At the bottom of the infographic, a summary statement notes that at least 40% of students across all race and ethnicity groups, genders, and sexual orientations experienced food and housing insecurity.
Key Finding: The survey results demonstrate that basic needs insecurity affects a significant portion of Southwestern College students, with housing insecurity, food insecurity, and homelessness representing substantial challenges that impact student well-being and success.
Get In Touch
We are here to support you! Visit us in person or contact us to let us know how we can help.
Office of Student Affairs
Room 68-105
900 Otay Lakes Rd
Chula Vista, CA 91910
Hours
Monday-Friday
8:00am - 5:00pm
Staff
Rachel Fischer Ed.D.
Assistant Superintendent/Vice President
rfischer@swccd.edu619-482-6315
Yesenia Olvera
Executive Assistant
yolvera@swccd.edu619-482-6316